Analytics & operational intelligence
Patterns you cannot see inside individual reports
When every audit shares the same structure, the picture across the programme becomes readable: what recurs, where, and with whom.
Overview
What this covers
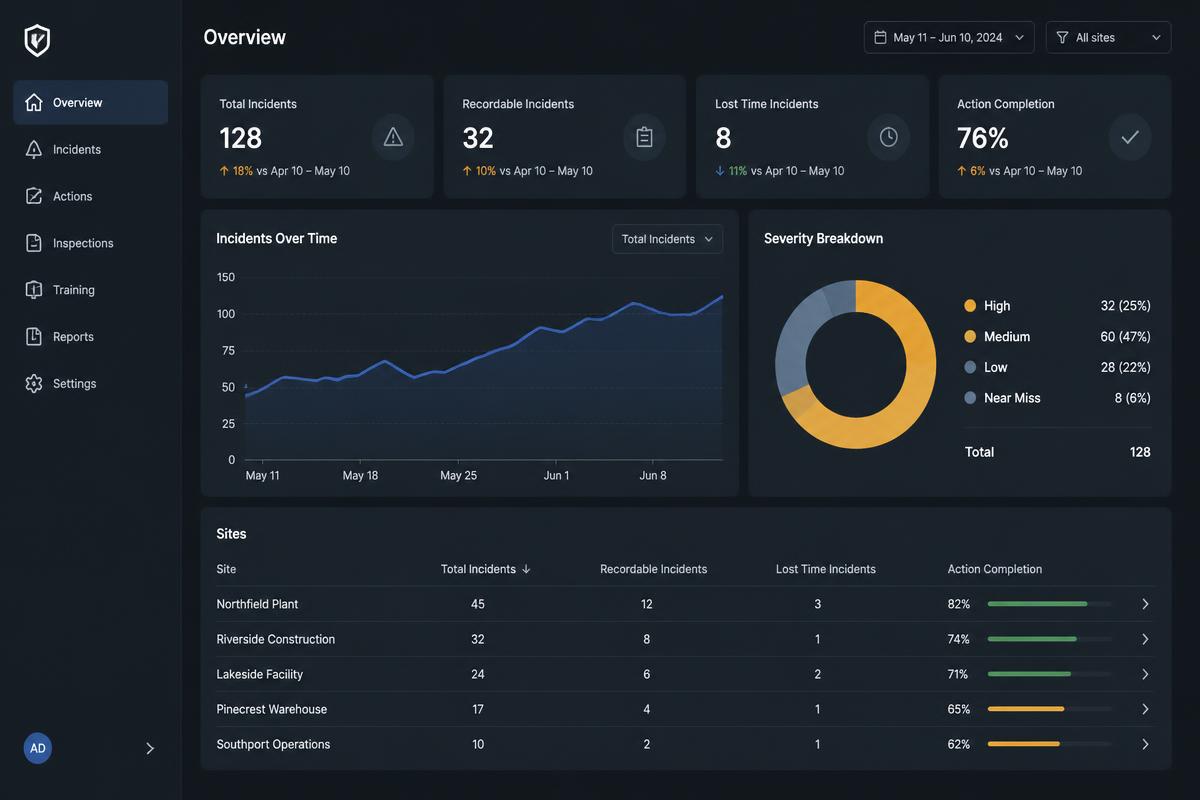
Analytics in Site Companion is built from the same findings your auditors record, so leadership views and site reality do not drift apart.
- Audit index and score trends over time
- Breakdowns by contractor, region, site and question set
- Repeat-finding identification across visits
- Severity distribution and movement
- Comparison between internal and independent audits
- Exportable data for wider business reporting
In detail
How teams use it
Programme view
Understand assurance across the whole contract rather than one visit at a time.
Repeat findings
Identify the issues that keep coming back so effort goes where it changes something.
Contractor comparison
See how delivery partners compare on the same question sets and definitions.
Severity movement
Track whether high-severity findings are reducing or simply being reclassified.
Question set insight
Spot standards that are widely misunderstood and need training or rewording.
Export
Take the underlying data into your own reporting when you need to.
Elsewhere in the platform
Connected to the rest of the process
Digital auditing
Schedule, assign and complete structured site inspections on mobile, online or offline.
AI prep + on-site coaching
AI-supported preparation before the visit and plain-English guidance while the auditor is on site.
Reports & evidence
Turn captured evidence into consistent, professional audit reports without rekeying anything.
Certificates & competency
Hold certificates, tickets and training records against the people and contractors doing the work.
Bulletins & safety comms
Issue safety bulletins and alerts to the field and record who has seen them.
Next step
See Site Companion against your own audit process
A short, practical walkthrough with the team that builds it. No obligation, no scripted pitch.